Forecasting in a Minute
What is forecasting, why it matters, 6 types, and how inline forecasting works — with a real interest-rate decision model walkthrough.

What Is Forecasting?
Forecasting is the process of using what you already know to make an educated guess about what will happen next.
Think about how you prepare for an exam. You don't study everything in the textbook from cover to cover. Instead, you make predictions — which chapters did the teacher emphasize? Which questions appeared in last year's paper? What topics were marked "important"? That mental model is forecasting. You're using past signals to prioritize future effort.

Why Does It Matter?
Without forecasting, every business decision is a coin flip. You're not managing risk — you're ignoring it. Forecasting replaces random guessing with structured thinking. It forces you to make your assumptions visible and traceable, so when reality diverges from the plan, you know exactly which assumption broke down.
Key decisions that depend on forecasting:
- What interest rate should we charge to maximize profit after defaults?
- How much capital do we need to invest this quarter?
- What revenue should we project accounting for customer churn?
How Is Forecasting Used?
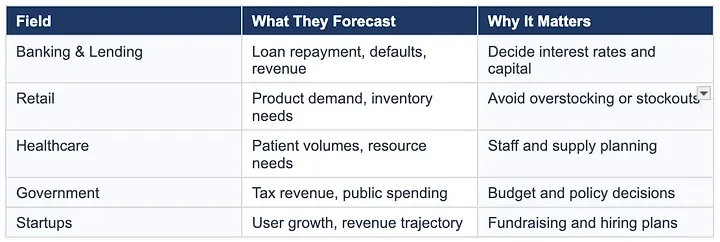
Forecasting appears everywhere. The specific metric changes, but the underlying logic is the same — use known data to estimate unknown outcomes.
Types of Forecasting
1 Time Series Forecasting
Uses historical time-ordered data to predict future values. Assumes patterns (trends, seasonality, cycles) will continue. Examples: ARIMA, Prophet, LSTM.
2 Qualitative Forecasting
Uses expert judgment, surveys, and market research instead of historical data. Best when data is scarce — new product launches, emerging markets.
3 Causal / Regression Forecasting
Models the relationship between an outcome and its drivers. "Sales increase by X for every Y drop in price." Uses regression and statistical models.
4 Scenario Forecasting
Builds multiple futures (optimistic, base, pessimistic) to bound uncertainty. Standard in strategic planning and risk management.
5 Market Sizing / Top-Down Forecasting
Starts from a total addressable market and works down using penetration rate assumptions. Common in startup pitches and new business cases.
6 Inline Forecasting
The forecast is not a separate document. It's woven directly into the decision model itself — future projections live in the same spreadsheet as the baseline, auto-updating when any assumption changes.
Inline Forecasting — Deep Dive
Most forecasting approaches produce a separate report that gets attached to a decision. Inline forecasting eliminates that gap. The model structure uses columns for years 2026–2029, with 2026 as the baseline calculation and future years using identical logic with updated growth assumptions. Change one cell — say, the default rate — and every year's profit projection updates automatically.
Sample Problem: Which Interest Rate Should We Choose?
A lending company is deciding between 30% and 35% annual interest rates on $10,000 loans with 12-month repayment. Higher rates mean more revenue per loan — but also higher default risk. Which generates greater profit after accounting for defaults?
The inline model runs both scenarios side by side, projecting customer growth at +5% annually from a 2026 baseline of 375,649 customers.

Result: The 35% rate generates approximately $67M more profit than the 30% rate — making it the financially superior choice at the modeled default rate. The key insight isn't just the answer; it's that the model lets you instantly re-run the comparison if the default rate assumption changes. One caveat: $67M is a point forecast. Before betting a roadmap on it, put a prediction interval around it — single-number forecasts hide exactly the uncertainty that matters most.
View the Model (Google Sheets)Key Takeaways
- Forecasting reduces uncertainty by making assumptions explicit and traceable — not by eliminating uncertainty.
- Inline forecasting consolidates assumptions, current calculations, and projections in one place, eliminating the static-report problem.
- Forecast quality = assumption quality. Garbage in, garbage out — but now you can see exactly where the garbage came from.
- Forecasting enables comparison. Without a model, you can't quantify the difference between two options.